Animated charts and data
Bar chart races, a number counting up, a line drawn and then annotated, a comparison table filling in row by row. A chart that appears all at once is a picture; a chart that arrives in an order is an argument, and the order is the whole reason to animate one. Give the agent the numbers and it builds the sequence around them.
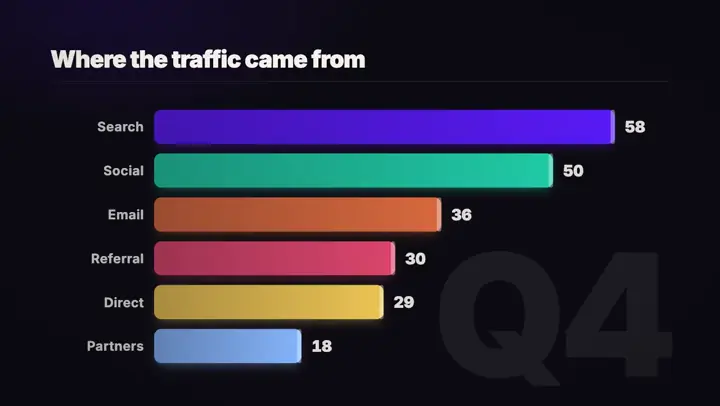
Bar chart race
>An animated bar chart racing to last quarter's numbers.
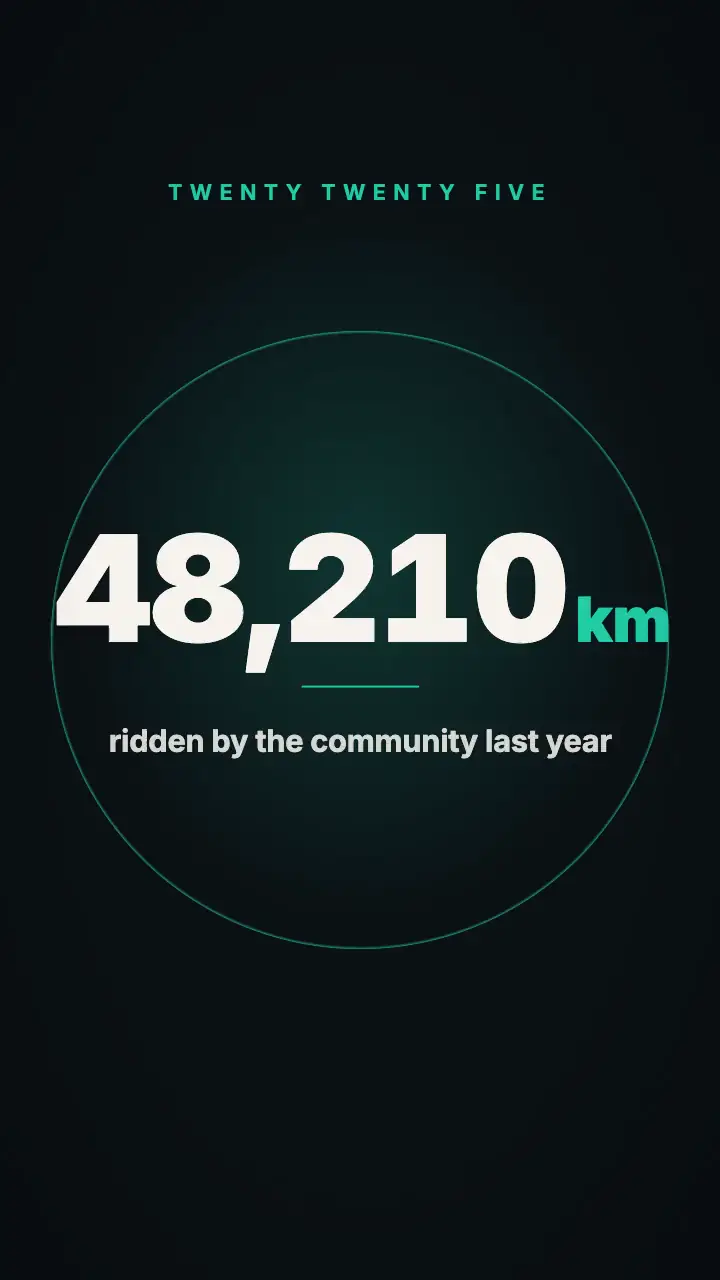
Big number
>One big number counting up, with a line of context under it.
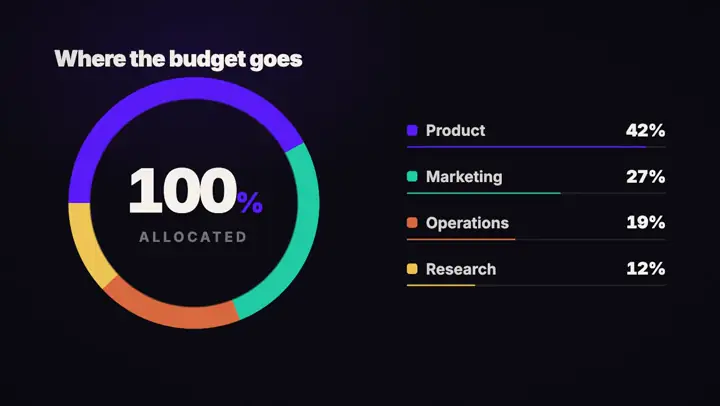
Share breakdown
>A donut showing how the budget splits four ways.
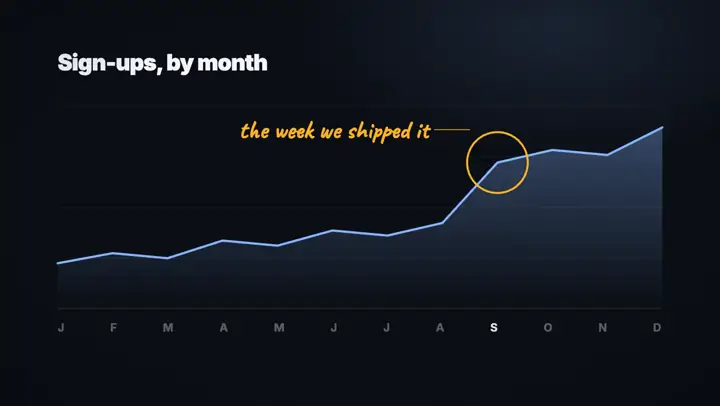
Line with a note
>Draw this line chart and circle the month it jumped.
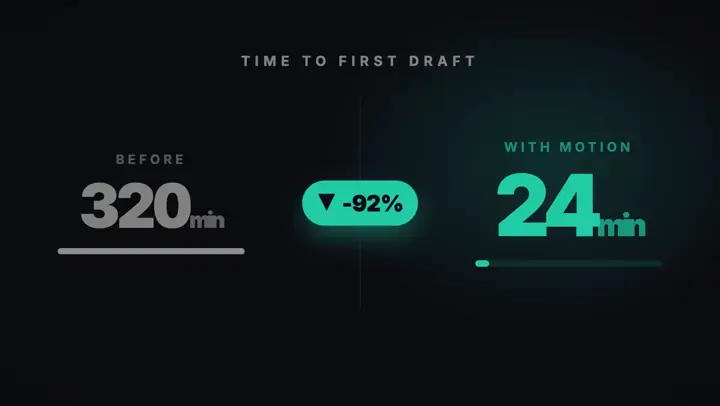
Before and after
>Two numbers side by side: what it was, what it is now.

Milestone timeline
>Walk along a timeline and stop at each milestone.
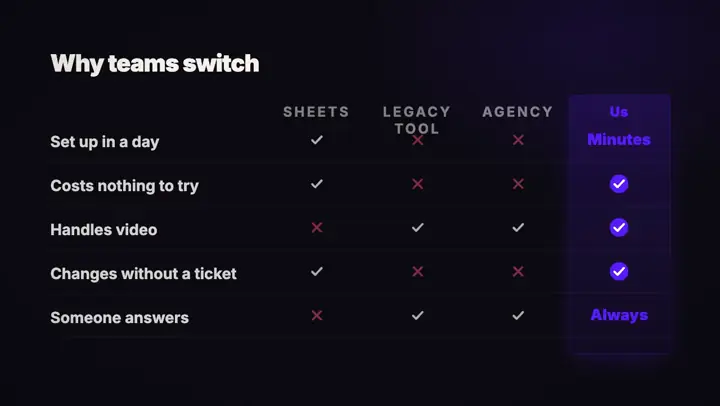
Comparison table
>Fill in a comparison table row by row, us in the last column.
7 of them — and yours will not look like any of these